
SCIENCE-DRIVEN
PERFORMANCE
RESULTS
SAVINGS

Soil structure.
The foundation of a soil’s growing potential.
The first thing we look at when assessing a farm’s ground is soil structure. This is what determines the ground’s ability to hold air, water—and life. It is a simple measure of a soil’s health.
A tight or compacted soil, with small pore spaces, restricts the amount of air and water in the soil—while a more open soil allows more particles, solutes and air to pass through. This type of soil is said to have more structure.
Poorly structured soils have smaller aerobic zones and are poor environments for roots and microbes. Plants and soil microbes need a deep aerobic zone to survive, thrive and store nutrients. They also need the water that can only be absorbed by soils with deeper aerobic zones.
Soil Tests Deliver Science-backed Results
-

Measuring needs vs results.
A foundational part of the Urth Agriculture’s approach involves our systematic soil testing and analysis performed BEFORE and THROUGHOUT the growing season. Our process provides critical insight on field-specific soil and growing conditions, plant and crop quality metrics and more. Along with our custom trial program, this testing has delivered valuable data on Urth products and their efficacy with more than 30 different crops.
-

Baseline and prep analysis.
We start with soil samples to obtain baseline values for soil nutrients and chemical characteristics. Samples are analyzed by acid extraction (Mehlich 3) as well as deionized water extraction (Saturated Paste). The Mehlich 3 results provide a general understanding of exchangeable nutrients (what’s present in the soil), while the Saturated Paste report defines soluble (what’s bio-available) nutrient levels.
Factors of focus include soil organic matter, pH, total exchange capacity, exchangeable vs. soluble macro and micronutrients as well as soil media density and carbon to nitrogen ratio.
Additional measurements include NPK and Carbon, measuring nitrogen in nitrate and ammonum form. In addition, phosphorus is measured in P2O5 form. Carbon is measured as soil organic matter (SOM) and as a ratio relative to nitrogen (C/N).
-

Key soil & plant health parameters.
Some of the most helpful data is collected through soil compaction tests with the use of a penetrometer, as well as electrical conductivity (EC) measurements with an EC meter.
For plant and crop quality we measure °BRIX using a refractometer, which provides an excellent indication of plant health and nutrient density.
Analysis of this information, along with grower feedback, goals and other input considerations, is what directs our recommended product protocols.


Measuring the aerobic zone.
Using a penetrometer to measure the pressure in soil can tell us how deep the aerobic zone is. Generally, the aerobic zone is soil with less than 300 psi, as feeder roots won’t grow in pressure greater than this.
Because of common agricultural practices, and years of traditional chemical applications, the vast majority of soils we see are in fact compacted and not providing optimal environments for microbial life and healthy plant growth.
We can easily fix soil compaction with our ultra-micronized calcium and enzyme products.
Improving soil structure.
Soils can begin to be improved by changing the ratio of minerals in the soil and their electrical charge, as measured with a EC meter. With the application of products like our GSR Calcium, we can rehabilitate soils and attain ratios of minerals that will result in healthier soils that are said to be flocculated.
Flocculated soils provide the environments necessary for proliferation of soil microbes. They are high in available calcium and electrically strong. Their soil colloids will not disperse when saturated—instead they will aggregate or clump together. By clumping together, the soil’s pore space increases and their critical aerobic zones will deepen.


Monitoring progress.
Over the course of the growing cycle, we continue to work with growers to monitor and record field conditions, crop development and harvest data.
Resulting increases in yield quantity and quality (including °BRIX readings), along with decreases in overall input costs are what make us a compelling economic partner for our customers.
See below for examples of soil analysis reports taken on US customer farms, as well as a test to determine levels of minerals and soil structure.
The end result.
Healthy soil partners with microbial activity and has a high degree of carbon storage. It is spongy with good tilth, and it absorbs water, allowing it to infiltrate the soil, without erosion or wash-away.
This type of soil is healthy, productive and profitable. It’s capable of producing larger harvests with better quality, high °BRIX crops—without the need for expensive or dangerous chemical inputs.
This is the type of soil we strive to help all customers achieve.
Critical Measuring Devices
-

Compaction Tester / Soil Penetrometer
The best test for soil compaction and structure is performed by measuring soil aerobic zone. Push the soil penetrometer into a soil until it reaches 300 psi. Mark the spot where the probe meets the top of the soil, then measure to the tip. This is the current depth plants can send their feeder roots.
Aerobic zone should be as deep as possible. The deeper the zone, the larger the area plant roots have to draw minerals from. Today most aerobic zones are 2-3 inches deep. Years ago it was not uncommon to see aerobic zones between 5 and 7 inches deep.
-

EC Meter
Conductivity is expressed as the amount of energy within soil. The energy needed for growth and development increases as the plant grows. ERGS of 200-400 are all that is needed at germination with needs increasing to 800 ERGS during seed filling.
Soils with a conductivity over 1000 are generally compacted and too “hot.”
-

Key soil and plant health parameters.
Brix is a measurement of the sugar level in plant extracts as created through photosynthesis and can be measured with a refractometer. There is a direct correlation between Brix levels and plant health.
Brix readings should be taken on a sunny day between the hours of 11:00 am and 4:00 pm. Sugar content in the plant should be at its highest during this time.
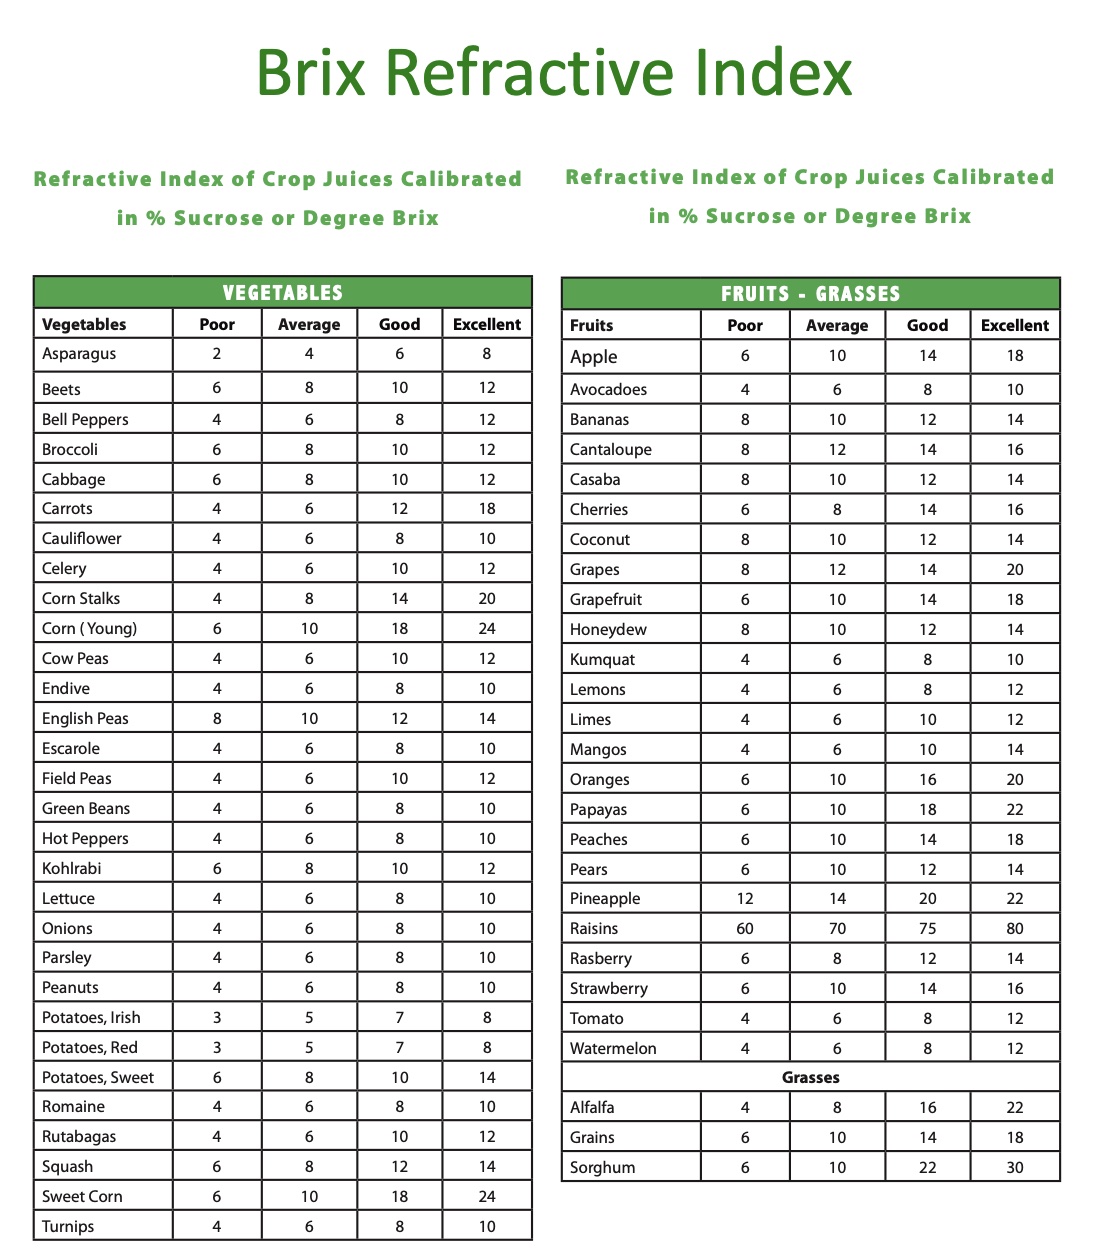
You can test the relative health and nutritional value of any fruits and vegetables you grow or purchase by checking their Brix. View a list of common crops and their desired Brix levels.


°Brix
A measure of plant health & quality.
°BRIX (symbol °Bx) is the sugar content of an aqueous solution. We can measure a plant’s °BRIX by squeezing any part of its sap onto a refractometer and looking at the sample’s refractive index.
The higher the refractive index °BRIX, the healthier and stronger the plant. And because high °BRIX tissue will produce more alcohol from fermented sugars, higher °BRIX plants are more resistant to the predatory insects that are unable to process them.
In crops, higher °BRIX means sweeter-tasting, more mineral nutritious food. And harvested fruits and vegetables with high °BRIX have shown better resistance to post harvest disease and lower water loss in storage.
Crops with higher sugar content will also have a lower freezing point and therefore be less prone to frost damage.
An early indicator of success.
A plant functioning at its genetic potential will have high °Brix. You can often can predict potential problems by measuring °BRIX before they develop into yield losses or drag.
In general, plants with °BRIX readings of 3-5 (higher than average) have improved resistance to most plant sap sucking insects, such as aphids, spider mites, leafhoppers, whiteflies, leaf miners, cucumber beetles, squash bugs, potato beetles and others.
Healthy ranges of °BRIX measurement varies between crops.
See the chart at left or download for recommended levels.
